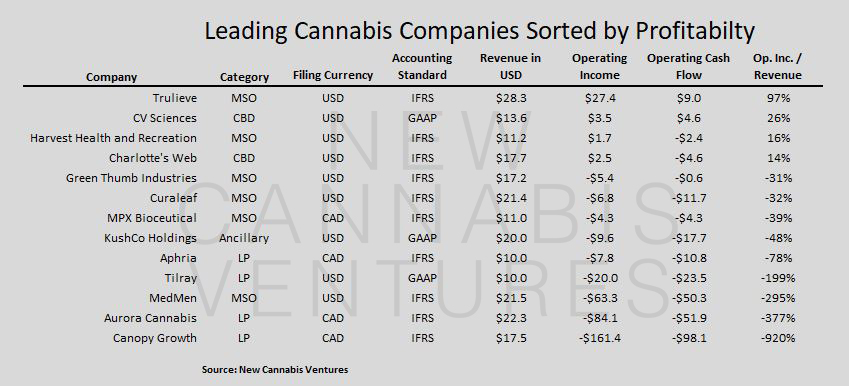
Each week, I begin the New Cannabis Ventures newsletter with some unique perspective. I wanted to share this week's intro, as it includes a graphic that I think everyone will find interesting.
A little more than a year ago, noting how quickly the publicly-traded cannabis stocks were beginning to track the real cannabis industry, we debuted the Public Cannabis Company Revenue Tracker, which is professionally managed by New Cannabis Ventures. Traders, investors and hedge funds alike have latched on to the data in this tracker to better understand the imbalance between cannabis companies operating within North America. With the completion of earnings season this week, we note that there are now 13 companies that generated US$10 million or more in their most recently reported quarter. Nine of these companies report in USD, while the other four report in CAD.
While we believe that revenue levels and growth rates are the primary metric investors are tracking in order to judge whether a company is even worth looking at to begin with, we expect the focus will start to include measures of profitability in 2019 as the industry continues to grow. Already we have noticed market participants doing a better job at no longer being misled by silly penny stock press releases, but instead starting to better evaluate and understand financial statements. For those who have been following us, you know we are excited about more diligent investors.
Among the thirteen companies below, we note that there are some extreme differences, even for those that are similar operationally. The large revenue producers include four different types of companies, including four Canadian licensed producers (LPs), six American multi-state operators (MSOs), two CBD from industrial hemp companies and one ancillary company.
We aren't going to weigh in on the individual companies in terms of judging the prudence of their spending levels, but we wanted to make sure are readers are aware of these differences. Those companies generating massive operating losses may be pursuing the smart strategy by investing aggressively ahead of scaling up further, or they may be wasting money. Alternatively, some of the companies generating profits may be missing opportunities to build durable franchises.
The table below provides in USD (converted at .752 for companies that file in CAD) levels of revenue, operating profit and operating cash flow for the most recent quarter. With the exception of Aphria, which most recently reported its FY19-Q1 ending in August, and KushCo Holdings, which reported its FY18-Q4 ending in August, all of the companies reported financials for the quarter ending in September. We divide the operating income by the revenue and then rank the 13 companies on this metric. Note that companies that use IFRS accounting instead of GAAP accounting may see operating income boosted by one-time changes in the fair value of biological assets.
While revenue has been the primary metric thus far, this is likely to change as the industry continues to scale up, with investors looking to other metrics, like operating income, EBITDA or even free cash flow. Investors should be aware of spending levels and try to assess them. Is the company wasting money? Is it not spending enough? One thing is certain: If investors don't see management as good stewards of capital, then the flow of capital will shut off, which could be detrimental to the share price as well as the ability to achieve corporate goals.
Recent free content from Cannabis Analyst
-
 Marketfy Has Evolved - We're Moving to a New Platform!
— 3/06/24
-
 420 Investor Weekly Review 12/23/22
— 12/26/22
-
 420 Investor Weekly Review 12/16/22
— 12/16/22
-
 420 Investor Weekly Review 12/09/22
— 12/09/22
-
 420 Investor Weekly Review 12/02/22
— 12/02/22


